In today's data-driven world, businesses are constantly seeking new ways to gain valuable insights from their data and make informed decisions. One technology that has emerged as a powerful tool in this regard is heat mapping. Heat mapping allows businesses to visualize data in a meaningful way, enabling them to uncover patterns, identify trends, and ultimately take action based on these insights.
Understanding Heat Mapping Technology
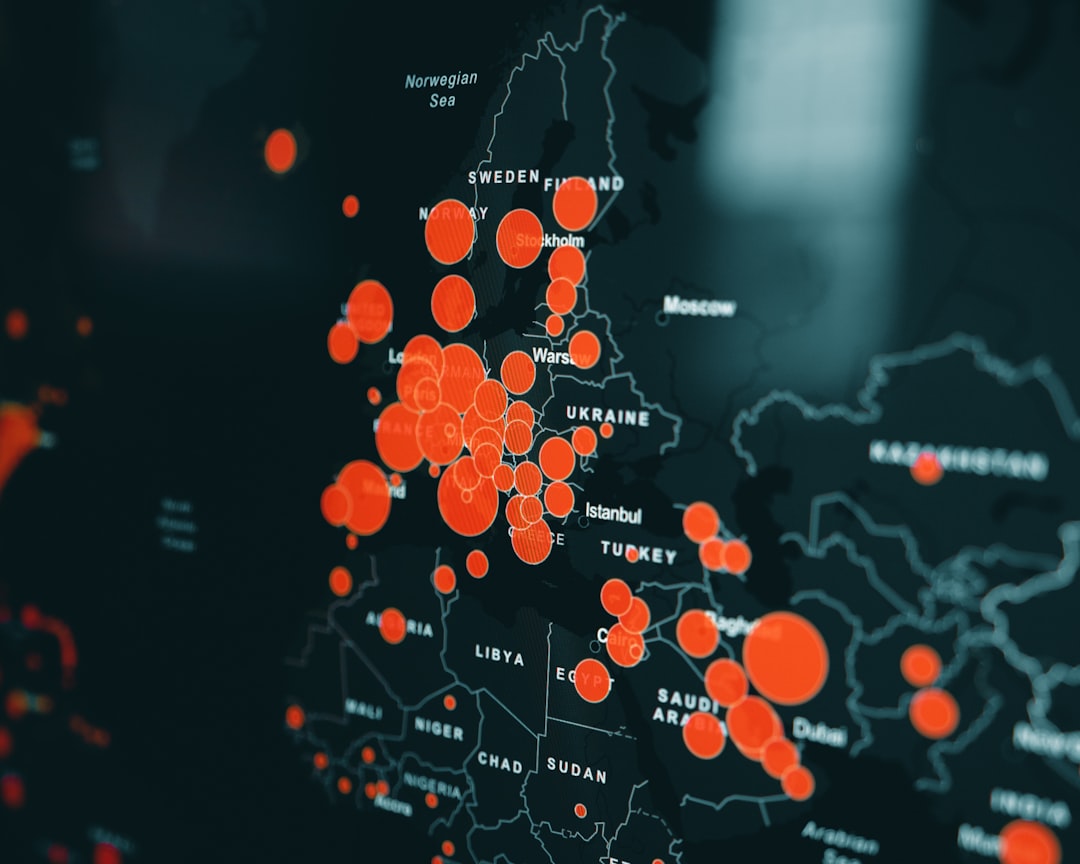
Heat mapping technology utilizes color-coded visual representations to display data on a two-dimensional surface, such as a webpage or a physical space. By analyzing user interaction, behavior, and engagement, businesses can gain a deeper understanding of how customers interact with their products, services, and digital platforms.
Unleashing the Benefits of Heat Mapping
The primary benefit of heat mapping lies in the insights it offers by leveraging data. Let's explore some of the various applications of heat maps:
1. User Behavior Analysis
One of the key applications of heat maps is user behavior analysis. By tracking and visualizing user interactions on websites or mobile applications, businesses can identify which areas attract the most attention and engagement. Heat maps show hotspots, represented by warmer colors, indicating areas that receive the highest levels of interaction. This information can help businesses optimize their website layout, improve user experience, and increase conversions.
2. Product Performance Tracking
Another valuable application of heat mapping is product performance tracking. By overlaying heat maps on product images or physical store layouts, businesses can identify which features or sections of a product generate the most interest or engagement. This data can be utilized to enhance product design, optimize product placement in physical stores, or make informed decisions about new product launches.
3. Marketing Optimization
Heat mapping can also help businesses optimize their marketing efforts. By analyzing click-through rates, scroll depth, and time spent on different elements of a marketing campaign, businesses can gain insights into what aspects resonate most with their target audience. This information can be used to tailor marketing messages, refine advertising strategies, and improve overall campaign effectiveness.
Effective Data Collection and Interpretation
Collecting and interpreting heat map data effectively is crucial for businesses to derive meaningful insights. Comprehensive data collection can be achieved through tools that capture user interactions, such as click tracking, scroll tracking, and eye-tracking technologies. Once the data is collected, businesses can utilize data visualization software to generate heat maps and draw insights from the patterns and trends they reveal.
Real-World Examples of Heat Mapping Success
One concrete example of a brand that has successfully harnessed the power of heat mapping is XYZ, a leading e-commerce company. By using heat maps, XYZ was able to identify areas of their website where users were dropping off during the checkout process. Armed with this information, they made improvements to the user interface, reducing friction and streamlining the checkout experience. As a result, XYZ saw a significant increase in conversion rates and overall sales.
Best Practices for Optimizing Heat Map Usage
To optimize the use of heat maps, businesses should consider the following best practices:
Clearly define goals: Start with a clear understanding of what you want to achieve with heat mapping, whether it's improving user experience, increasing conversions, or enhancing marketing campaigns.
Prioritize data accuracy: Ensure that the data collected for heat mapping accurately represents user interactions and behavior. Use reliable tools and methods to collect data.
Continuously analyze and iterate: Regularly review and analyze heat map data to identify opportunities for improvement. Use A/B testing and iterative design processes to make data-driven changes.
Combine quantitative and qualitative insights: Heat maps provide quantitative data, but to gain a holistic understanding of user behavior, combine them with qualitative feedback, such as surveys and user testing.
Keep privacy and security in mind: When collecting user data for heat mapping, prioritize user privacy and comply with relevant data protection regulations.
In conclusion, heat mapping technology offers businesses a powerful tool to transform raw data into actionable insights. By visualizing data in the form of heat maps, businesses can gain valuable understanding of user behavior, product performance, and marketing effectiveness. By effectively collecting and interpreting heat map data, businesses can make informed decisions, improve marketing strategies, increase efficiency, and ultimately boost sales.
Note: This article is for informational purposes only and does not endorse or promote any specific brand or product.
Sources: